⚠ The Challenge
Raw housing data contains features like total rooms that are meaningless without context. A house with 20 rooms could be a mansion or a tiny apartment with many residents — raw numbers mislead models.
💡 The Approach
Feature engineering created meaningful ratios from raw numbers. Then trained 6 regression models to compare which best captures non-linear relationships between location, demographics, and price.
🔄 Step-by-Step Process
Loaded California Housing Dataset with 20,640 samples and 8 raw features
Engineered 4 new features: rooms_per_household, bedrooms_per_room, population_per_household, income_per_room
Applied log transformation to skewed features and StandardScaler normalization
Trained 6 models: Linear Regression, Ridge, Lasso, Decision Tree, Random Forest, XGBoost
XGBoost achieved R² 0.83 — best performer on this dataset
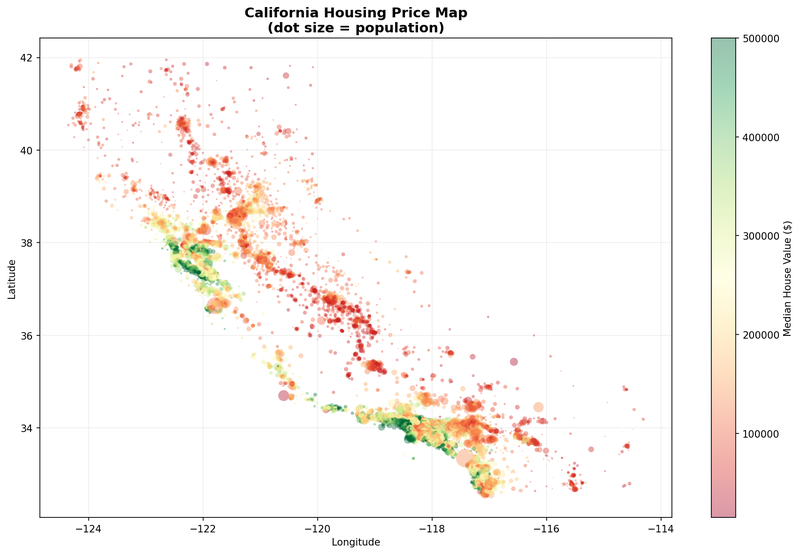
Built geographic price heatmap showing actual vs predicted prices across California
✓ Final Result
XGBoost R² 0.83. Interactive geographic heatmap shows price patterns across California. Custom price predictor generates estimates for any property specification.
📚 Key Lesson
Feature engineering often matters more than model selection. The engineered ratio features improved all models by 8-15% R² compared to raw features alone.