⚠ The Challenge
Results were wildly inconsistent between stocks. Tesla R² was 0.9131 but Apple R² was only 0.014 — essentially random. Same architecture, same hyperparameters, completely different outcomes.
💡 The Approach
Analysis revealed LSTM captures momentum patterns. It excels on stocks with clear directional trends. Apple had an extended sideways period where momentum signals were absent, making LSTM ineffective.
🔄 Step-by-Step Process
Downloaded 6 years of daily OHLCV data for 5 major stocks via yfinance API
Built 3-layer stacked LSTM: 128 → 64 → 32 units with dropout regularization
Used 60-day sliding window sequences — model sees 60 days to predict the next day
Applied MinMaxScaler normalization — essential for LSTM training stability
Trained with early stopping (patience=8) and ReduceLROnPlateau learning rate scheduling
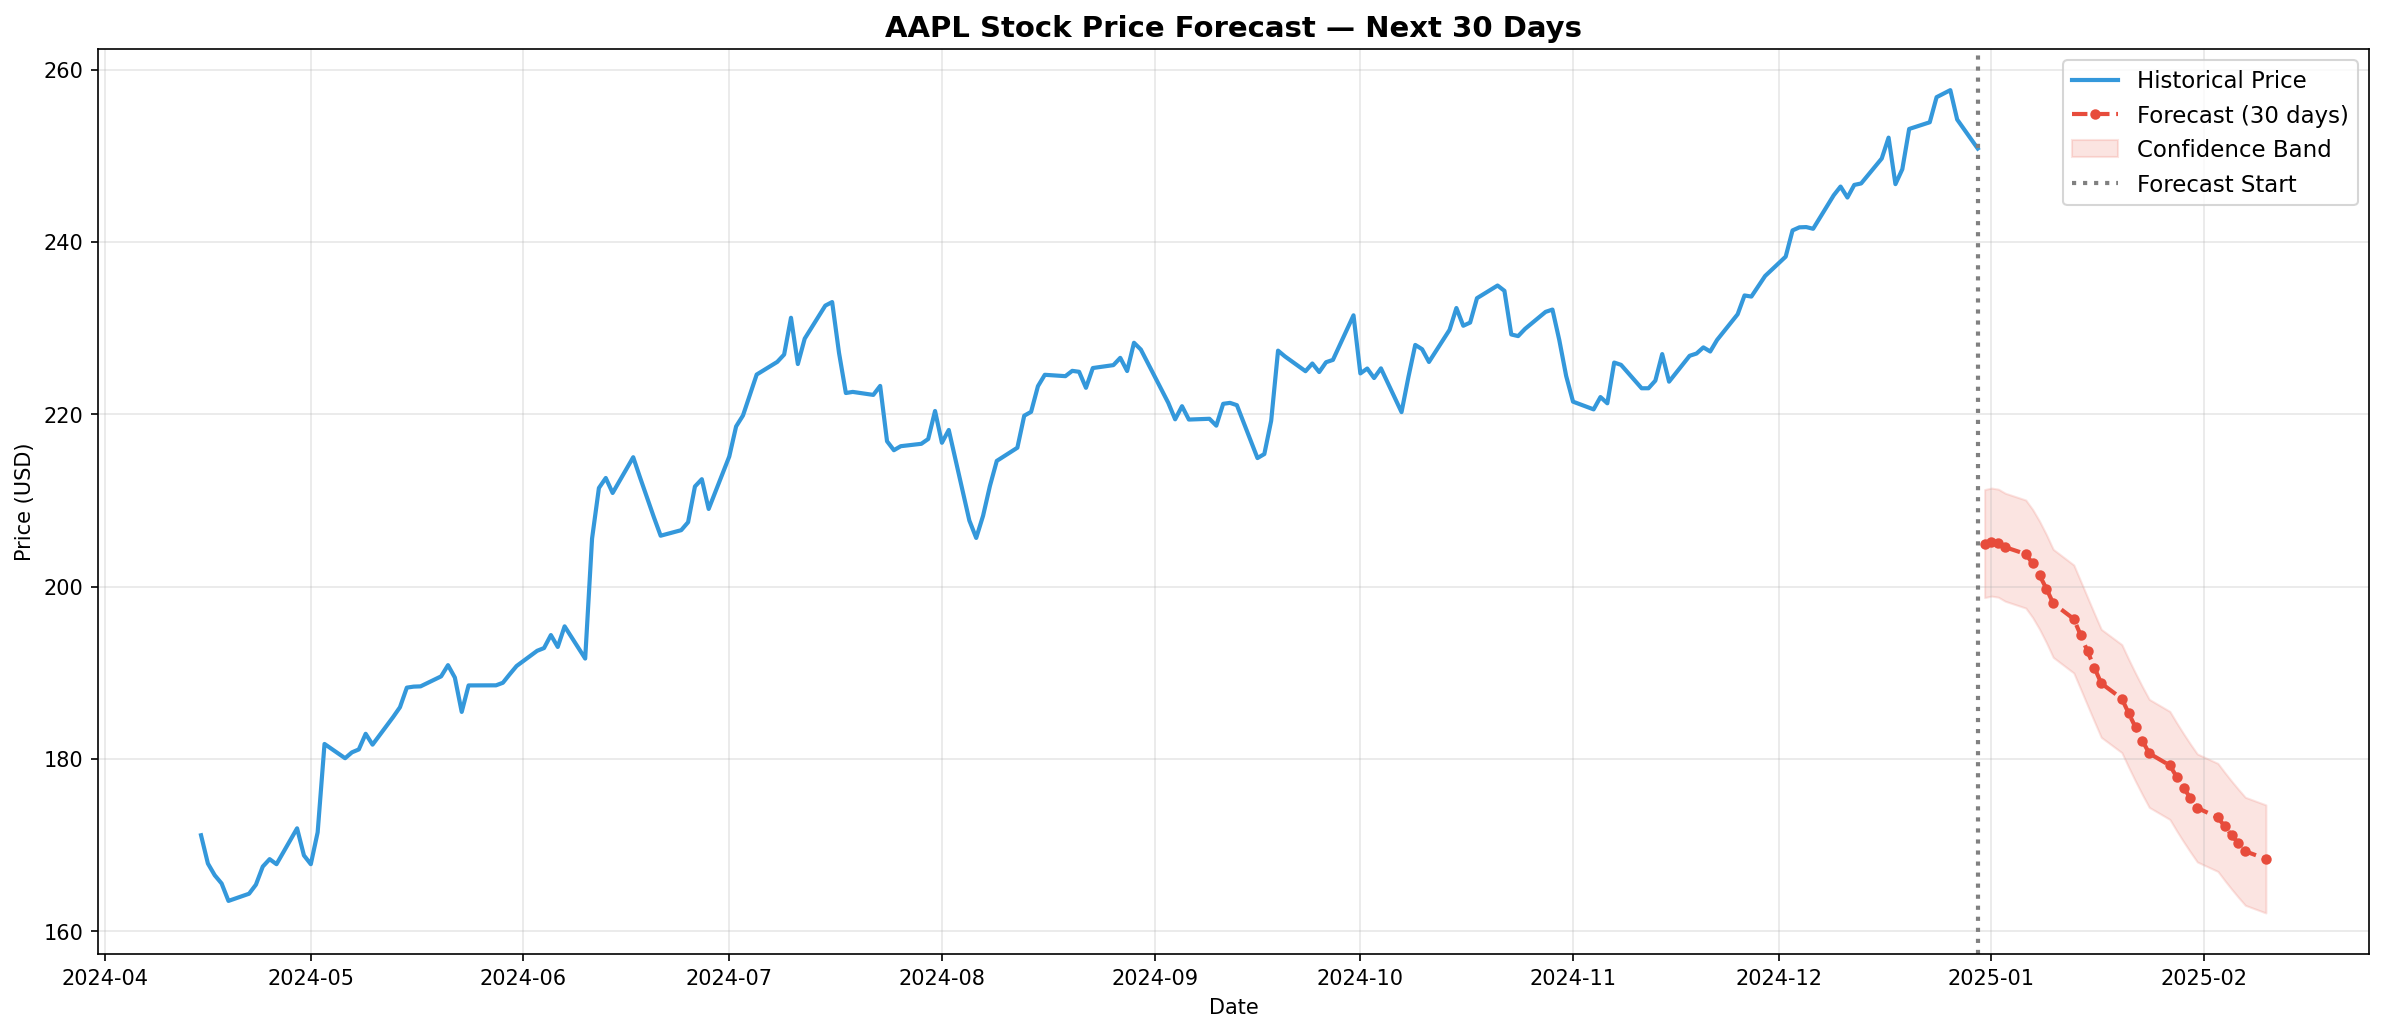
Built 30-day future forecast with confidence visualization in Streamlit dashboard
✓ Final Result
TSLA R² 0.9131, GOOGL R² 0.8324 — strong performance on momentum-driven stocks. Interactive dashboard allows live prediction for any stock symbol worldwide using real-time Yahoo Finance data.
📚 Key Lesson
Always test your model on multiple stocks before claiming success. Volatile, momentum-driven stocks suit LSTM well. Flat, low-volatility stocks do not — know your model's limits.